
You often read or hear
references to the ‘1-in-200 year event’, or ‘200-year event’, or ‘event with a
return period of 200 years’. Other popular horizons are 1-in-30 years and
1-in-10,000 years. This term applies to hazards which can occur over a range of
magnitudes, like volcanic eruptions, earthquakes, tsunamis, space weather, and
various hydro-meteorological hazards like floods, storms, hot or cold spells,
and droughts.
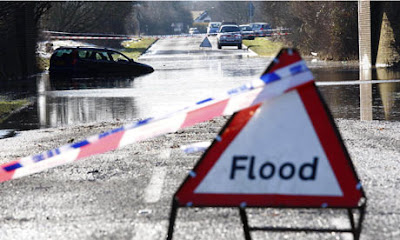

‘1-in-200 years’ refers to a
particular magnitude. In floods this might be represented as a contour on a
map, showing an area that is inundated. If this contour is labelled as
‘1-in-200 years’ this means that the current rate of floods at least as large
as this is 1/200 /yr, or 0.005 /yr. So if your house is inside the contour,
there is currently a 0.005 (0.5%) chance of being flooded in the next year, and
a 0.025 (2.5%) chance of being flooded in the next five years. The general
definition is this:
‘1-in-200 year magnitude is x’ = ‘the current rate for
events with magnitude at least x is 1/200 /yr’.
Statisticians and risk
communicators strongly deprecate the use of ‘1-in-200’ and its ilk.
First, it gives the impression, wrongly, that the forecast is expected to hold for the next 200 years, but it is not: 0.005 /yr is our assessment of the current rate, and this could change next year, in response to more observations or modelling, or a change in the environment.
First, it gives the impression, wrongly, that the forecast is expected to hold for the next 200 years, but it is not: 0.005 /yr is our assessment of the current rate, and this could change next year, in response to more observations or modelling, or a change in the environment.
Second, even if the rate is
unchanged for several hundred years, 200 yr is the not the average waiting time
until the next large-magnitude event. It is the mathematical expectation of the
waiting time, which is a different thing. The average is better represented by
the median, which is 30% lower, i.e. about 140 yr. This difference between the
expectation and the median arises because the waiting-time distribution has a
strong positive skew, so that lots of short waiting-times are balanced out a
few long ones. In 25% of all outcomes, the waiting time is less than 60 yr, and
in 10% of outcomes it is less than 20 yr.
So to use ‘1-in-200 year’ in
public discourse is very misleading. It gives people the impression that the
event will not happen even to their children’s children, but in fact it could
easily happen to them. If it does happen to them, people will understandably
feel that they have been very misled, and science and policy will suffer
reputational loss, which degrades its future effectiveness.
So what to use instead? 'Annual rate of 0.005 /yr' is much less graspable than its
reciprocal, '200 yr'. But ‘1-in-200 year’ gives people the misleading
impression that they have understood something. As Mark Twain said “It
ain't what you don't know
that gets you into trouble. It's what you know for sure that just ain't so.” To
demystify ‘annual rate of 0.005 /yr’, it can be associated with a much larger
probability, such as 0.1 (or 10%). So I suggest ‘event with a 10% chance of
happening in the next 20 yr’.
 Blog post by Prof. Jonathan Rougier, Professor of Statistical Science.
First blog in series here.
Third blog in series here.

First blog in series here.
Third blog in series here.