
 |
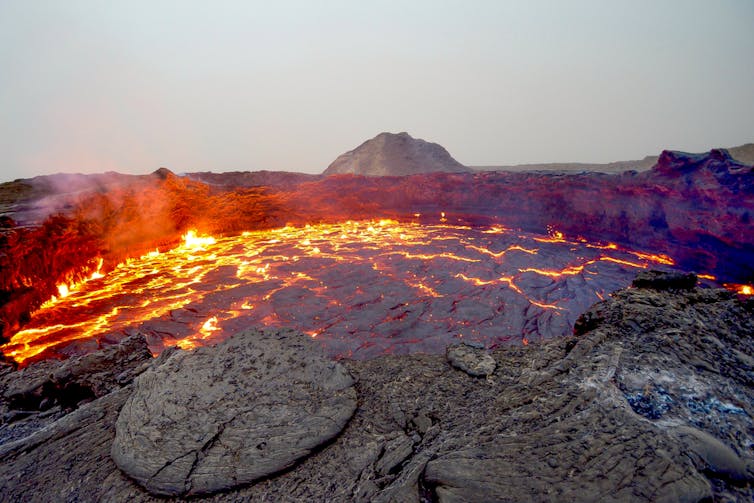
| Erta Ale in eastern Ethiopia. mbrand85 |
Ethiopia tends to conjure images of sprawling dusty deserts, bustling streets in Addis Ababa or the precipitous cliffs of the Simien Mountains – possibly with a distance runner bounding along in the background. Yet the country is also one of the most volcanically active on Earth, thanks to Africa’s Great Rift Valley, which runs right through its heart.
Rifting is the geological process that rips tectonic plates apart, roughly at the speed your fingernails grow. In Ethiopia this has enabled magma to force its way to the surface, and there are over 60 known volcanoes. Many have undergone colossal eruptions in the past, leaving behind immense craters that pepper the rift floor. Some volcanoes are still active today. Visit them and you find bubbling mud ponds, hot springs and scores of steaming vents.
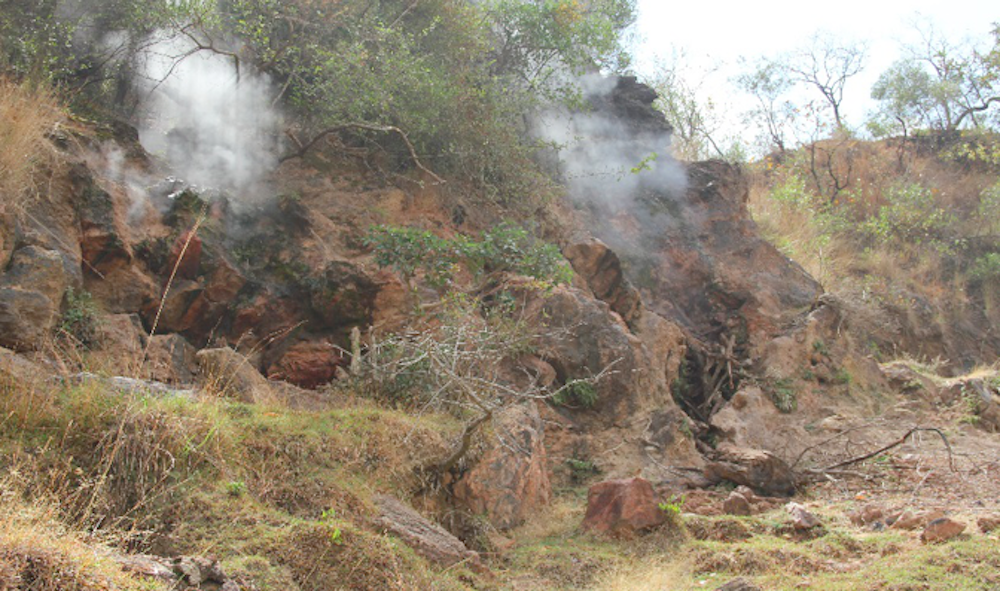 |
| Steam rising at Aluto volcano, Ethiopia. William Hutchison |
Geothermal power has recently become a serious proposition thanks to geophysical surveys suggesting that some volcanoes could yield a gigawatt of power. That’s the equivalent of several million solar panels or 500 wind turbines from each. The total untapped resource is estimated to be in the region of 10GW.
Converting this energy into power would build on the geothermal pilot project that began some 20 years ago at Aluto volcano in the lakes region 200km south of Addis Ababa. Its infrastructure is currently being upgraded to increase production tenfold, from 7MW to 70MW. In sum, geothermal looks like a fantastic low-carbon renewable solution for Ethiopia that could form the backbone of the power sector and help lift people out of poverty.
Scratching the surface
The major problem is that, unlike more developed geothermal economies like Iceland, very little is known about Ethiopia’s volcanoes. In almost all cases, we don’t even know when the last eruption took place – a vital question since erupting volcanoes and large-scale power generation will not make happy bedfellows.In recent years, the UK’s Natural Environment Research Council (NERC) has been funding RiftVolc, a consortium of British and Ethiopian universities and geological surveys, to address some of these issues. This has focused on understanding the hazards and developing methods for exploring and monitoring the volcanoes so that they can be exploited safely and sustainably.
Teams of scientists have been out in the field for the past three years deploying monitoring equipment and making observations. Yet some of the most important breakthroughs have come through an entirely different route – through researchers analysing satellite images at their desks.
This has produced exciting findings at Aluto. Using a satellite radar technique, we discovered that the volcano’s surface is inflating and deflating. The best analogy is breathing – we found sharp “inhalations” inflating the surface over a few months, followed by gradual “exhalations” which cause slow subsidence over many years. We’re not exactly sure what is causing these ups and downs, but it is good evidence that magma, geothermal waters or gases are moving around in the depths some five km below the surface.
Taking the temperature
In our most recent paper, we used satellite thermal images to probe the emissions of Aluto’s steam vents in more detail. We found that the locations where gases were escaping often coincided with known fault lines and fractures on the volcano.When we monitored the temperature of these vents over several years, we were surprised to find that most were quite stable. Only a few vents on the eastern margin showed measurable temperature changes. And crucially, this was not happening in synchronicity with Aluto’s ups and downs – we might have expected that surface temperatures would increase following a period of inflation, as hot fluids rise up from the belly of the volcano.
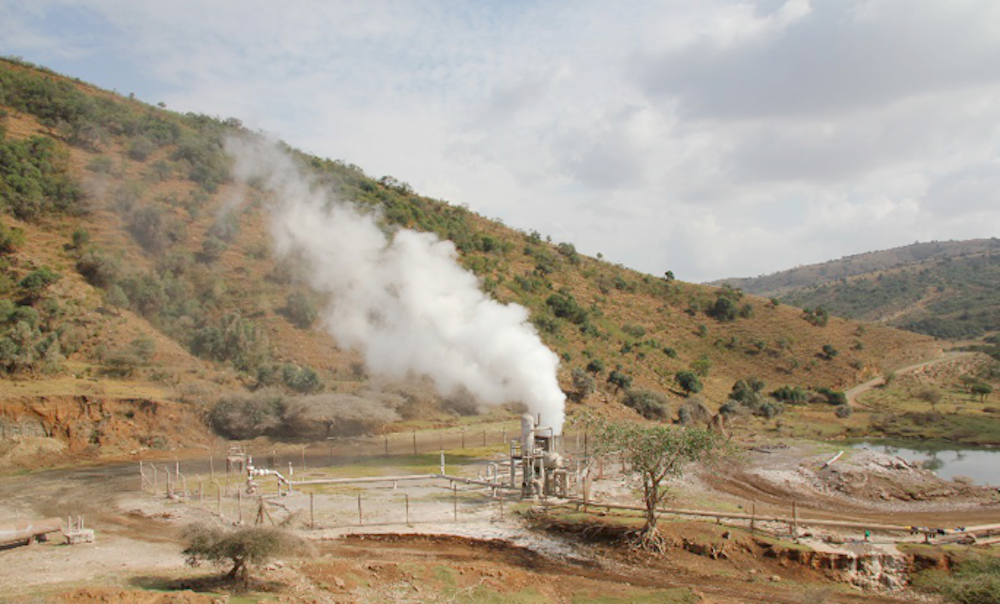 |
| A productive geothermal well on Aluto. William Hutchison |
It was only when we delved into the rainfall records that we came up with an explanation: the vents that show variations appear to be changing as a delayed response to rainfall on the higher ground of the rift margin. Our conclusion was that the vents nearer the centre of the volcano were not perturbed by rainfall and thus represent a better sample of the hottest waters in the geothermal reservoir. This obviously makes a difference when it comes to planning where to drill wells and build power stations on the volcano, but there’s a much wider significance.
This is one of the first times anyone has monitored a geothermal resource from space, and it demonstrates what can be achieved. Since the satellite data is freely available, it represents an inexpensive and risk-free way of assessing geothermal potential.
With similar volcanoes scattered across countries like Kenya, Tanzania and Uganda, the technique could allow us to discover and monitor new untapped geothermal resources in the Rift Valley as well as around the world. When you zoom back and look at the big picture, it is amazing what starts to come into view.
-------------------------------
This blog is written by William Hutchison, Research Fellow, University of St Andrews; Juliet Biggs, Reader in Earth Sciences and Cabot Institute member, University of Bristol, and Tamsin Mather, Professor of Earth Sciences, University of Oxford
This article was originally published on The Conversation. Read the original article.
------------------------------
Juliet Biggs is a member of the University of Bristol Cabot Institute. She studies Continental Tectonics and Volcanic Deformation and has won numerous awards in her field. Find out more about Juliet Biggs research.